


Killed in traffic accidents in 2016
301,660 people
Injured in traffic accidents in 2016
8,514,590 people
Total cost of traffic accidents in 2016
$ 126,015,936,298
Killed today
130 people
Injured today
3,674 people
Total cost today
$ 54,367,060
Find Your Country
 Argentina
Killed in traffic accidents in 2015
1,242 people
Injured in traffic accidents in 2015
22,438 people
Total cost of traffic accidents in 2015
$ 1,265,024,843
Population 41,300,000 – 12.4 deaths per 100,000 inhabitants – Risk of dying in a traffic accident 0.9%
Australia
Killed in traffic accidents in 2015
291 people
Injured in traffic accidents in 2015
7,973 people
Total cost of traffic accidents in 2015
$ 4,865,480,166
Population 23,100,000 – 5.2 deaths per 100,000 inhabitants – Risk of dying in a traffic accident 0.4%
Austria
Killed in traffic accidents in 2015
129 people
Injured in traffic accidents in 2015
9,933 people
Total cost of traffic accidents in 2015
$ 2,676,014,091
Population 8,400,000 – 6.3 deaths per 100,000 inhabitants – Risk of dying in a traffic accident 0.5%
Belgium
Killed in traffic accidents in 2015
187 people
Injured in traffic accidents in 2015
10,751 people
Total cost of traffic accidents in 2015
$ 1,897,537,265
Population 11,100,000 – 6.9 deaths per 100,000 inhabitants – Risk of dying in a traffic accident 0.6%
Cambodia
Killed in traffic accidents in 2015
478 people
Injured in traffic accidents in 2015
3,799 people
Total cost of traffic accidents in 2015
$ 80,037,149
Population 14,700,000 – 13.4 deaths per 100,000 inhabitants – Risk of dying in a traffic accident 0.9%
Canada
Killed in traffic accidents in 2015
488 people
Injured in traffic accidents in 2015
28,099 people
Total cost of traffic accidents in 2015
$ 5,643,956,993
Population 34,800,000 – 5.8 deaths per 100,000 inhabitants – Risk of dying in a traffic accident 0.5%
Chile
Killed in traffic accidents in 2015
482 people
Injured in traffic accidents in 2015
8,416 people
Total cost of traffic accidents in 2015
$ 98,282,699
Population 17,402,630 – 11.4 deaths per 100,000 inhabitants – Risk of dying in a traffic accident 0.9%
Colombia
Killed in traffic accidents in 2015
1,441 people
Injured in traffic accidents in 2015
15,310 people
Total cost of traffic accidents in 2015
$ 729,822,025
Population 46,600,000 – 12.7 deaths per 100,000 inhabitants – Risk of dying in a traffic accident 1.0%
Czech Republic
Killed in traffic accidents in 2015
181 people
Injured in traffic accidents in 2015
4,988 people
Total cost of traffic accidents in 2015
$ 559,530,219
Population 10,500,000 – 7.1 deaths per 100,000 inhabitants – Risk of dying in a traffic accident 0.6%
Denmark
Killed in traffic accidents in 2015
41 people
Injured in traffic accidents in 2015
760 people
Total cost of traffic accidents in 2015
$ 389,238,413
Population 5,600,000 – 3.0 deaths per 100,000 inhabitants – Risk of dying in a traffic accident 0.2%
Finland
Killed in traffic accidents in 2015
62 people
Injured in traffic accidents in 2015
1,393 people
Total cost of traffic accidents in 2015
$ 608,185,021
Population 5,400,000 – 4.7 deaths per 100,000 inhabitants – Risk of dying in a traffic accident 0.4%
France
Killed in traffic accidents in 2015
889 people
Injured in traffic accidents in 2015
14,703 people
Total cost of traffic accidents in 2015
$ 5,838,576,199
Population 63,400,000 – 5.8 deaths per 100,000 inhabitants – Risk of dying in a traffic accident 0.5%
Germany
Killed in traffic accidents in 2015
876 people
Injured in traffic accidents in 2015
72,894 people
Total cost of traffic accidents in 2015
$ 8,514,590,290
Population 81,800,000 – 4.4 deaths per 100,000 inhabitants – Risk of dying in a traffic accident 0.4%
Greece
Killed in traffic accidents in 2015
239 people
Injured in traffic accidents in 2015
3,005 people
Total cost of traffic accidents in 2015
$ 904,979,311
Population 10,800,000 – 9.1 deaths per 100,000 inhabitants – Risk of dying in a traffic accident 0.7%
Hungary
Killed in traffic accidents in 2015
147 people
Injured in traffic accidents in 2015
3,691 people
Total cost of traffic accidents in 2015
$ 510,875,417
Population 10,000,000 – 6.1 deaths per 100,000 inhabitants – Risk of dying in a traffic accident 0.5%
Iceland
Killed in traffic accidents in 2015
2 people
Injured in traffic accidents in 2015
178 people
Total cost of traffic accidents in 2015
$ 49,141,350
Population 319,575 – 2.8 deaths per 100,000 inhabitants – Risk of dying in a traffic accident 0.2%
Ireland
Killed in traffic accidents in 2015
39 people
Injured in traffic accidents in 2015
1,365 people
Total cost of traffic accidents in 2015
$ 194,619,207
Population 4,600,000 – 3.5 deaths per 100,000 inhabitants – Risk of dying in a traffic accident 0.3%
Israel
Killed in traffic accidents in 2015
64 people
Injured in traffic accidents in 2015
3,037 people
Total cost of traffic accidents in 2015
$ 958,499,593
Population 7,700,000 – 3.3 deaths per 100,000 inhabitants – Risk of dying in a traffic accident 0.3%
Italy
Killed in traffic accidents in 2015
889 people
Injured in traffic accidents in 2015
45,426 people
Total cost of traffic accidents in 2015
$ 7,298,220,249
Population 60,600,000 – 6.0 deaths per 100,000 inhabitants – Risk of dying in a traffic accident 0.5%
Japan
Killed in traffic accidents in 2015
1,274 people
Injured in traffic accidents in 2015
161,811 people
Population 126,000,000 – 4.1 deaths per 100,000 inhabitants – Risk of dying in a traffic accident 0.3%
Korea
Killed in traffic accidents in 2015
1,312 people
Injured in traffic accidents in 2015
54,410 people
Total cost of traffic accidents in 2015
$ 5,096,590,474
Population 48,900,000 – 10.8 deaths per 100,000 inhabitants – Risk of dying in a traffic accident 0.9%
Lithuania
Killed in traffic accidents in 2015
73 people
Injured in traffic accidents in 2015
772 people
Total cost of traffic accidents in 2015
$ 92,930,671
Population 2,980,000 – 10.1 deaths per 100,000 inhabitants – Risk of dying in a traffic accident 0.7%
Luxembourg
Killed in traffic accidents in 2015
8 people
Injured in traffic accidents in 2015
248 people
Population 500,000 – 6.5 deaths per 100,000 inhabitants – Risk of dying in a traffic accident 0.5%
Malaysia
Killed in traffic accidents in 2015
1,683 people
Injured in traffic accidents in 2015
4,263 people
Population 28,800,000 – 23.6 deaths per 100,000 inhabitants – Risk of dying in a traffic accident 1.7%
Netherlands
Killed in traffic accidents in 2015
158 people
Injured in traffic accidents in 2015
4,671 people
Total cost of traffic accidents in 2015
$ 3,332,853,914
Population 16,700,000 – 3.9 deaths per 100,000 inhabitants – Risk of dying in a traffic accident 0.3%
New Zealand
Killed in traffic accidents in 2015
75 people
Injured in traffic accidents in 2015
2,336 people
Total cost of traffic accidents in 2015
$ 610,617,761
Population 4,500,000 – 6.9 deaths per 100,000 inhabitants – Risk of dying in a traffic accident 0.6%
Norway
Killed in traffic accidents in 2015
35 people
Injured in traffic accidents in 2015
1,434 people
Total cost of traffic accidents in 2015
$ 513,308,158
Population 5,000,000 – 2.9 deaths per 100,000 inhabitants – Risk of dying in a traffic accident 0.2%
Poland
Killed in traffic accidents in 2015
869 people
Injured in traffic accidents in 2015
9,012 people
Total cost of traffic accidents in 2015
$ 1,289,352,244
Population 38,500,000 – 9.2 deaths per 100,000 inhabitants – Risk of dying in a traffic accident 0.7%
Portugal
Killed in traffic accidents in 2015
175 people
Injured in traffic accidents in 2015
7,266 people
Total cost of traffic accidents in 2015
$ 510,875,417
Population 10,500,000 – 6.8 deaths per 100,000 inhabitants – Risk of dying in a traffic accident 0.6%
Serbia
Killed in traffic accidents in 2015
167 people
Injured in traffic accidents in 2015
3,094 people
Total cost of traffic accidents in 2015
$ 170,291,806
Population 7,200,000 – 9.7 deaths per 100,000 inhabitants – Risk of dying in a traffic accident 0.7%
Slovenia
Killed in traffic accidents in 2015
32 people
Injured in traffic accidents in 2015
1,640 people
Total cost of traffic accidents in 2015
$ 141,098,925
Population 2,100,000 – 6.3 deaths per 100,000 inhabitants – Risk of dying in a traffic accident 0.5%
Spain
Killed in traffic accidents in 2015
463 people
Injured in traffic accidents in 2015
20,220 people
Total cost of traffic accidents in 2015
$ 2,797,651,095
Population 46,200,000 – 4.1 deaths per 100,000 inhabitants – Risk of dying in a traffic accident 0.3%
Sweden
Killed in traffic accidents in 2015
63 people
Injured in traffic accidents in 2015
4,006 people
Total cost of traffic accidents in 2015
$ 1,386,661,847
Population 9,600,000 – 2.7 deaths per 100,000 inhabitants – Risk of dying in a traffic accident 0.2%
Switzerland
Killed in traffic accidents in 2015
82 people
Injured in traffic accidents in 2015
4,415 people
Total cost of traffic accidents in 2015
$ 2,773,323,695
Population 8,000,000 – 4.3 deaths per 100,000 inhabitants – Risk of dying in a traffic accident 0.4%
Thailand
Killed in traffic accidents in 2015
6,398 people
Injured in traffic accidents in 2015
153,787 people
Total cost of traffic accidents in 2015
$ 1,751,572,860
Population 65,104,000 – 38,1 deaths per 100,000 inhabitants – Risk of dying in a traffic accident 2,8%
United Kingdom
Killed in traffic accidents in 2015
426 people
Injured in traffic accidents in 2015
46,222 people
Total cost of traffic accidents in 2015
$ 8,879,501,303
Population 64,800,000 – 3,5 deaths per 100,000 inhabitants – Risk of dying in a traffic accident 0,4%
United States
Killed in traffic accidents in 2015
9,001 people
Injured in traffic accidents in 2015
571,694 people
Total cost of traffic accidents in 2015
$ 56,098,986,313
Population 321,517,000 – 11,6 deaths per 100,000 inhabitants – Risk of dying in a traffic accident 1,3%
The truth behind the traffic accident statistics
To give you an idea of how dangerous traffic accidents can be, in the time it took me to write this story, 3121 people were killed in a car accident and 80,889 were injured. The rate of fatalities and serious injuries in traffic accidents is so high that getting in a car is one of the most dangerous things a human being can do in their lifetime.
It’s among the top 10 killers of human beings in the world. Car accidents are responsible for more deaths each day than any wild beast or natural catastrophe.
Car accidents kill more people than wars do. More people have died in car accidents SO FAR in 2015 than the number of US Soldiers killed in action in Vietnam (58,220 fatal casualties).
Why is that? What is it about car accidents that makes them so deadly?
Well cars are essentially big balls of metal and glass traveling at deadly speeds. And the faster you go, the more dangerous it is. And for as sturdy as they look, if you’ve ever seen a car accident in person, you’ll know that those metal frames cripple a lot easier than you would think.
On top of the fact that one of the most deadly things that can happen to the human body is an impact that completely stops motion, especially at 100 kilometers per hour. On top of that, some people behave unsafely in the car; not sitting properly, not wearing a seat belt, and other things like that can contribute to death.
But even if you’re doing everything right, all it takes is for someone else to be driving in an unsafe way, and then boom! They can plow into your side of the car and you’d be dead or permanently crippled instantly.
You don’t even need to be moving fast in your car to be killed; according to this study, half of all fatalities occurred with cars going under 50 km/h.
What causes car accidents?
Google’s self-driving cars have reminded us of one sobering fact; human beings suck at driving.
13 out of the 14 accidents the google cars have been in were the fault of other motorists hitting the car, and the 14th one happened, not surprisingly at all, while an employee was driving it manually. The causes of car crashes always fall under one of two categories: poor conditions or human error.
Human error
Driving while drunk is a notorious death sentence. Every year, many people are killed as a result of drunk drivers. Alcohol, as I’m sure most of us are aware, impairs your depth perception, vision, stability, judgement and awareness; all important things that you need in order to maneuver your large 4-wheeled death-trap.
Driving while under the influence of alcohol is one of the most dangerous, selfish and stupid things you can ever do. Every year, thousands of people die as a result of drunk driving.
In 2013, the CDC reported that 31% of all traffic fatalities in the US, or 10,076 deaths, were the result of drunk drivers. 200 of those people were children under the age of 14.
Another form of impaired driving that often leads to accidents is the use of marijuana. While marijuana isn’t all that bad, it does impair your cognitive functions and awareness, which can cause car accidents.
In fact, French researcher Bernard Laumon and his team concluded that 2.5% of traffic fatalities in France were caused by people driving while high. Driving while under the influence of cannabis is dangerous, and should be avoided.
It’s not only drugs or alcohol that impair your driving capabilities though. Research has shown that driving while extremely tired can be just as dangerous as driving drunk.
Think about this for a minute; being sleepy definitely impairs your awareness, it weakens your vision and hearing, slows your thinking and judgement, and even affects your balance.
But that’s not all. Driving while sleepy can also lead to something that is far more dangerous that even driving drunk: falling asleep at the wheel of the car. When you fall asleep at the wheel, you have zero control over the vehicle, which is extremely deadly. Yet, for something this bad, so many people do it.
According to a study done by the National Sleep Foundation, around 103 million drivers in the US have fallen asleep while driving at some point.
There are lots of reasons why people drive drowsy; they don’t realize it’s dangerous, they don’t think they have to drive very far, they’re travelling and feel like they can’t stop until they reach the destination, etc.
However, if you’re exhausted or barely able to stay awake, you should not be driving. Yet so many people do it. In fact, some people even reported that they drive while drowsy almost daily.
Another human error that frequently causes accidents is breaking traffic laws. Speeding, running red lights, cutting people off, passing improperly, not wearing a seatbelt or sitting improperly all contribute to traffic fatalities. The thing is, traffic laws, including speed limits exist for two reasons; to enable traffic to move efficiently and to move safely.
Breaking the laws for traffic puts you at risk of causing a car accident.
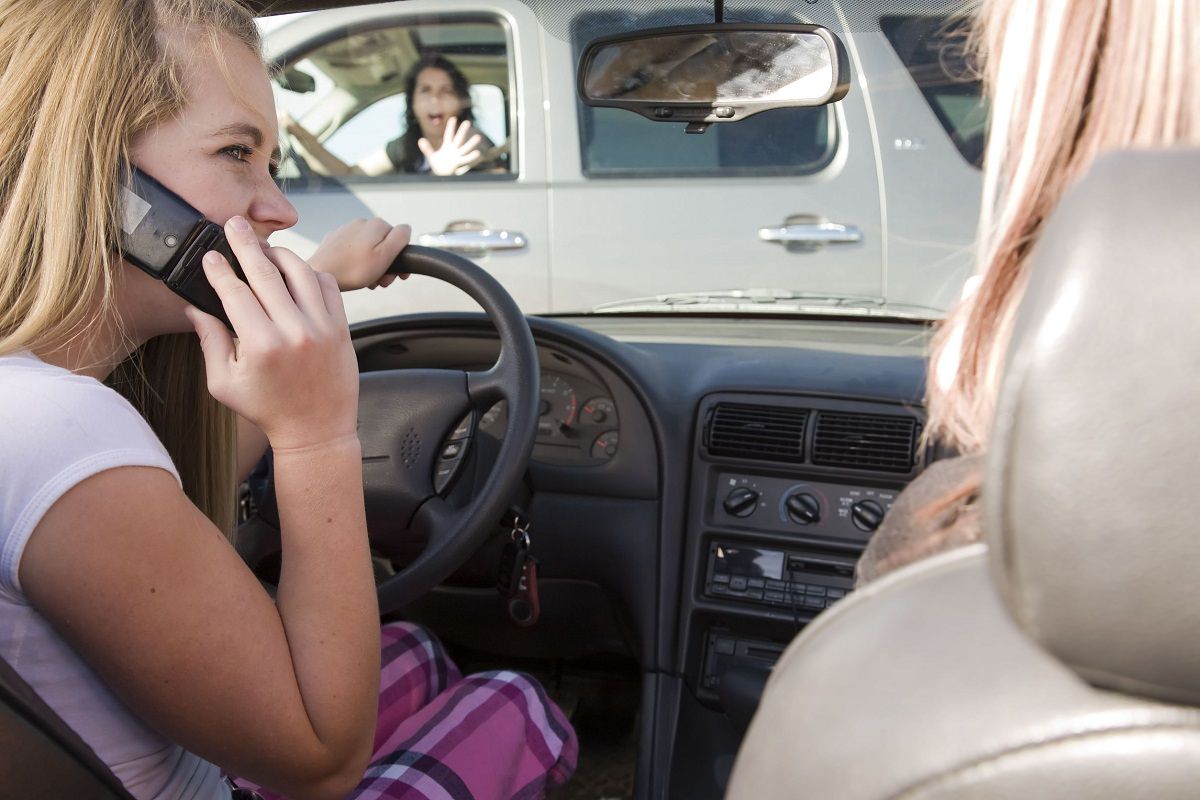
Distracted driving, or in other words texting, talking on the phone, eating or doing something else that occupies the senses you need to drive (sight, touch and hearing) and/or occupies your hands, has been getting a lot of attention in recent years for its role in car fatalities.
The unfortunate part of human error accidents, is that a significant number of the fatalities involved do not include the person responsible; in other words rather than killing themselves by driving drunk, high, tired or recklessly, often these motorists kill others. At the risk of turning this into a lecture, it is extremely important for you to drive safely.
I happened to lecture a young man a few weeks ago about drunk driving, and I’ll share what I said to him here (hopefully quoting myself doesn’t make me sound pretentious): “it might interest you to know these laws against drunk driving don’t exist to protect you from yourself. It’s not about you. It’s to protect innocent people from dying because of you. That’s why it really sucks to get a DUI.”
End of the lecture. Let’s move on to the other cause of accidents: poor conditions.
Poor Conditions
There are all sorts of things outside of human control that have a huge impact on your driving, and can lead to accidents.
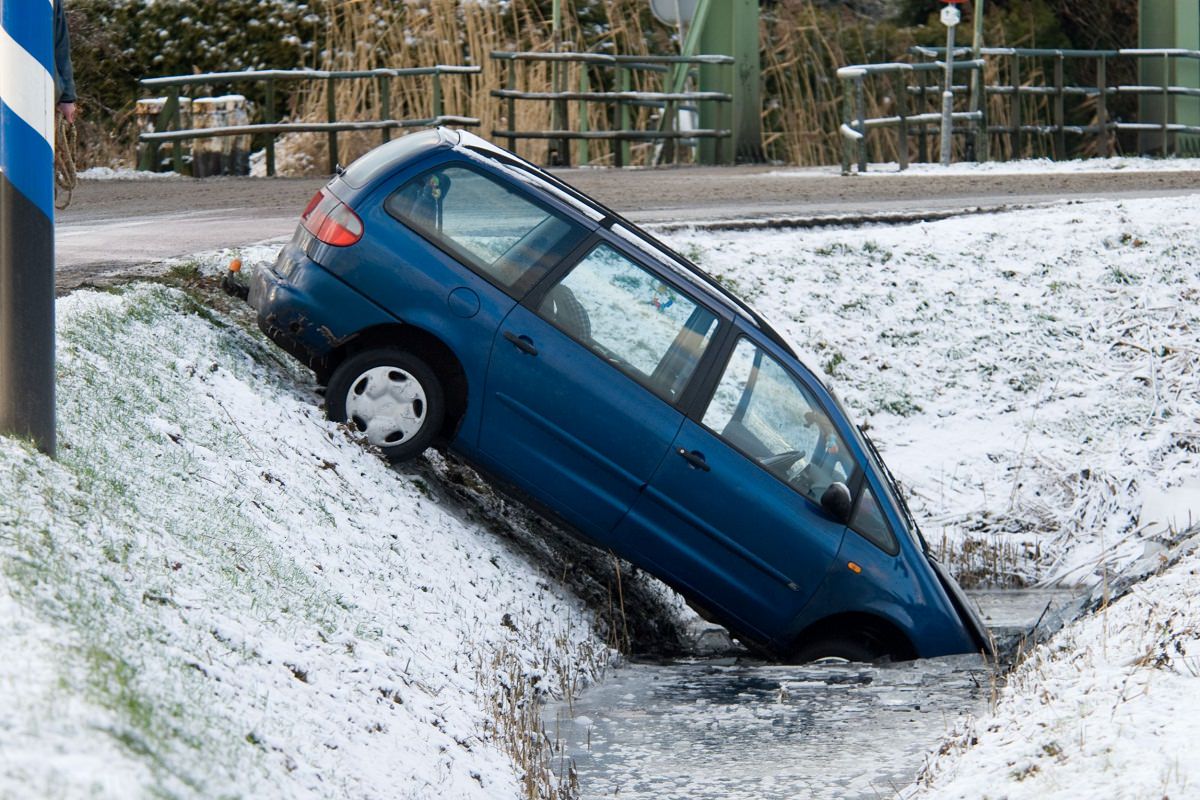
Weather can be a big problem for motorists. Ice-y roads can be a death sentence to an un-prepared driver. Every year the ice causes many fatal accidents. Especially “black ice”. Black ice is particularly dangerous because it’s nearly impossible to see from your car, meaning that you will almost never know you’re about to drive over a patch of it until you actually hit it.
This past winter was especially rough on people in the USA, since many places in the United States that don’t usually have particularly harsh winters were swamped with ice and slush (snow on its own isn’t particularly bad, but wet, slippery snow and slush are hazardous) and that caused a spike in car accidents.
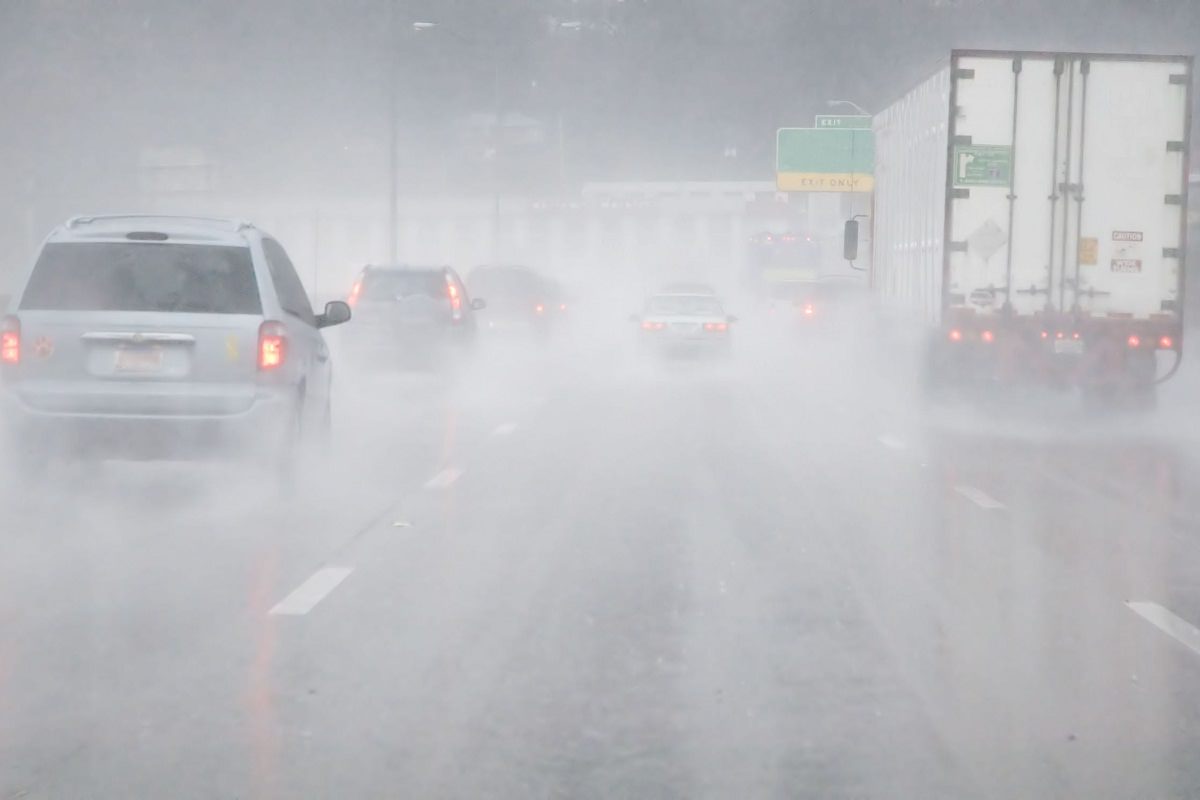
Similarly to ice, heavy rain can cause all kinds of troubles with the roads, making them slippery. Heavy storms can also knock debris onto the roads, which can be a major problem, especially when you’re driving at high speeds.
And in the same vein, damaged roads can also cause accidents. Things like potholes may seem like nothing more than an annoyance, but they have caused drivers to lose control of their vehicles, and even caused tyres to pop.
There are also many conditions that obstruct the driver’s vision, making it extremely difficult to see, and therefore avoid crashing. Heavy snowfall and rain are difficult to see through, making stormy days a nightmare for motorists everywhere. The key to driving in a bad storm is to either simply not do it, or if you have to, take things slow and drive cautiously. Heavy fog, like stormy weather, dangerously obstructs vision.
When it comes to low visibility, ice buildup on the windshield is also a big one; it might not seem like much, but it drastically impairs your ability to see. On that note, even the sun is out to get you; when directly facing the sun, the sunlight makes it impossible to see properly, which is why it is recommended that you wear sunglasses when driving on a really sunny day.
Safer alternatives to driving
There are many alternatives to driving that are safer. For starters, they take one less car off the road, which means one less driver to get into an accident, and two, the alternatives are less likely to result in deaths.
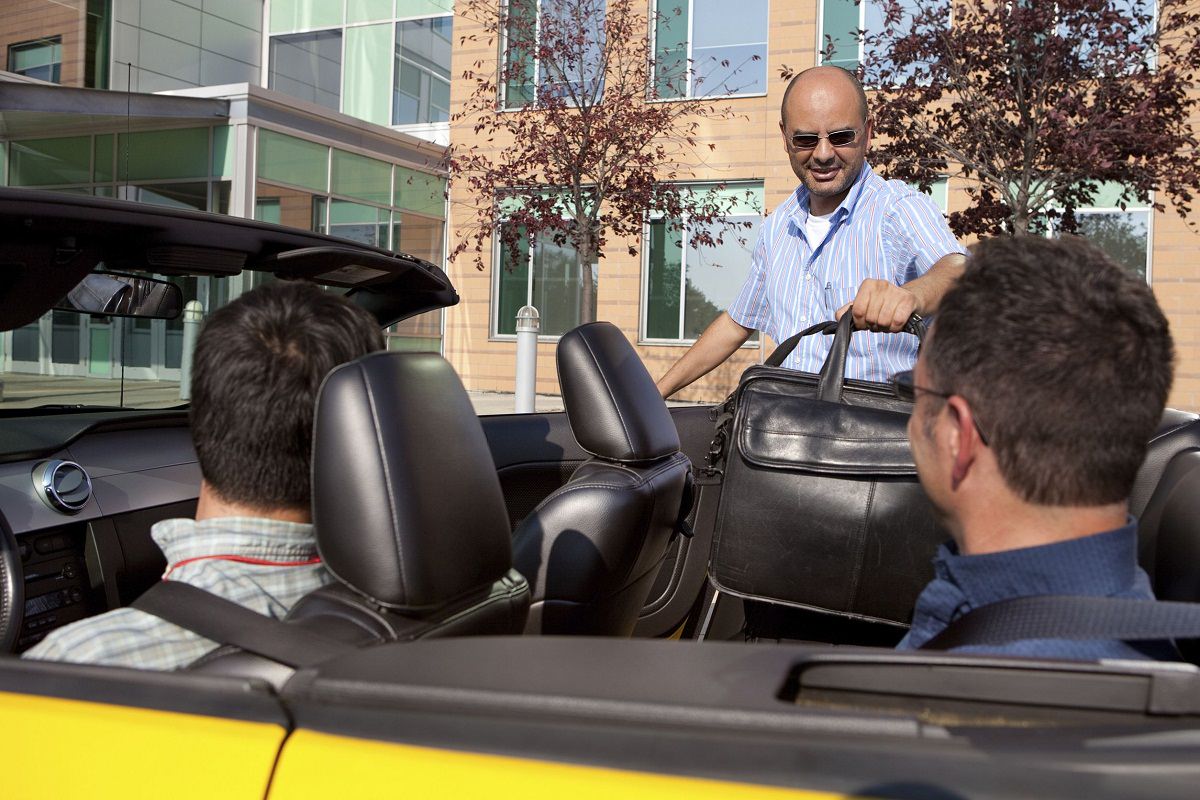
One of these alternatives, which still involves driving, is to carpool with someone. Essentially all that means is if multiple drivers are along the same route and traveling to the same place, one of them can just pick up the others to reduce the number of cars that need to be used. Obviously this comes with a little snag; you’re still using a car. This is the same problem you encounter when using a cab/Uber to get around.
Especially in big cities, public transportation has improved dramatically in recent years, making it an effective and reasonable way to travel. These buses, trains, subways and street cars prove to be a reasonably priced means of getting around the area. And public transit is a safe alternative. Deaths on public transit are rare, and mostly confined to violent crimes and suicides.
Of course, the downside to a bus is also pretty obvious; you’re limited based on the bus routes, times and stops. And of course, somehow it’s always the bus you need the most that has the most awkward stops and inconvenient schedule.

Say you’re trying to travel a far distance, and the idea of getting on a coach bus for 10+ hours is about as appealing as taking a bath in napalm. In that case, you can always fly. Flying is one of the safest ways to travel. It’s also exceptionally efficient, cutting your travel time by a significant number. That being said, flying isn’t without its drawbacks either.
When you fly you’re also subject to the flight schedules. Flying also isn’t a cheap affair. It costs a lot of money to buy plane tickets.
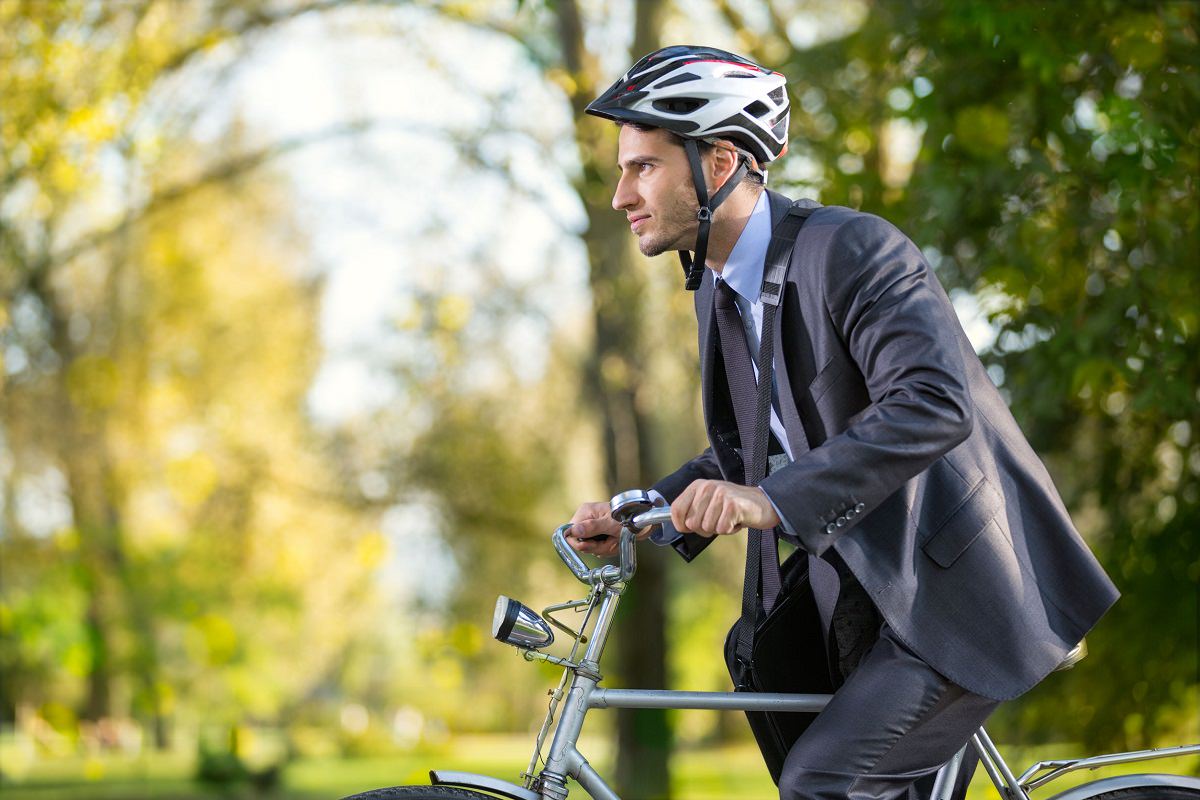
When it comes to driving locally, there’s another alternative to public transit and carpooling that has been gathering much more attention lately; the idea of riding a bicycle.
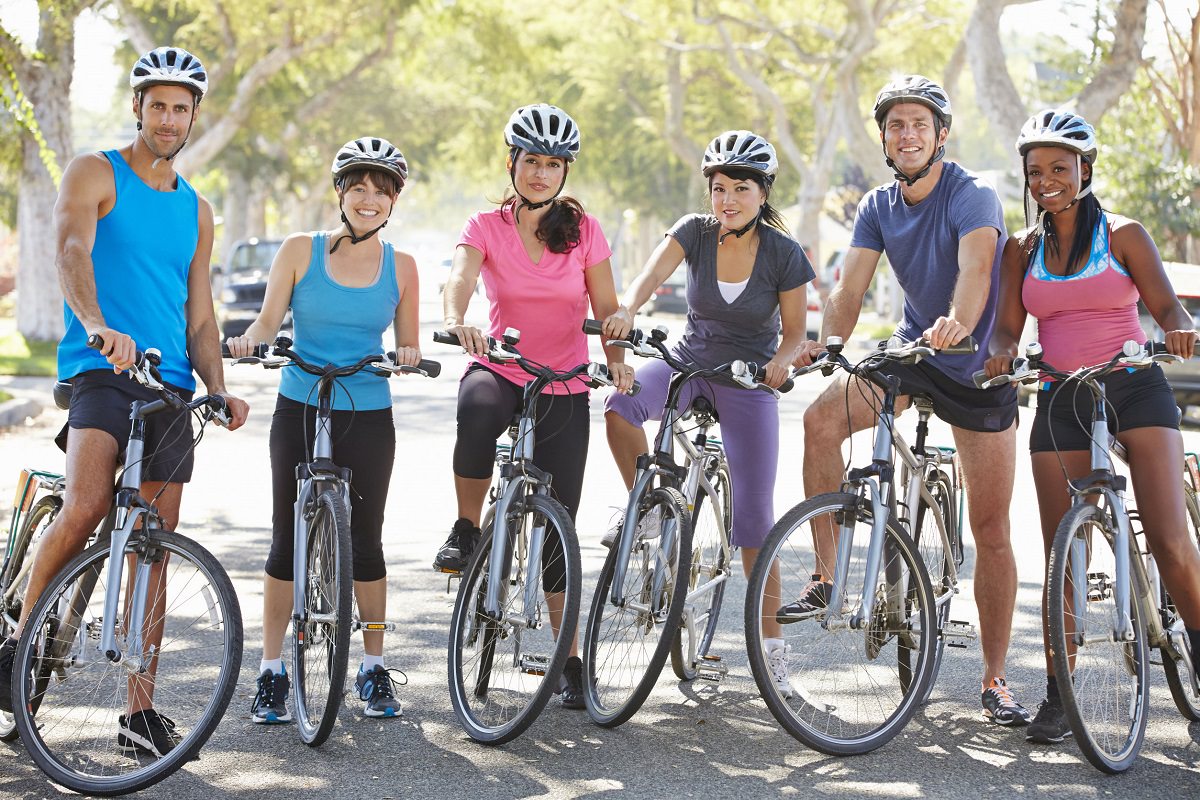
Cycling has often been dismissed as something that cannot possibly be safe, however looking at the numbers disproves that claim. According to the US Department of Transportation, only 741 cyclists were killed in traffic accidents in 2013. In that same year, 32,719 people were killed in car accidents.
There are two things to take away from this. First, cycling is a safe and efficient alternative to traveling by car locally. Statistically, cyclists are at a very low risk of being injured while traveling, especially in comparison to motorists. The second thing this teaches us is that the biggest threat to cyclists is motorists.
In bicycle cities like Copenhagen where bicycles are the mainstream method of transportation, traffic fatalities are actually drastically reduced. This is simply because less cars and more bicycles make the roads safer for everyone traveling.
Ultimately, the numbers speak for themselves. Cars are still useful tools for transportation, however the incredibly danger associated with them should not be ignored. Hundreds of thousands of deaths every year could be easily avoided if bicycles became the dominant mode of local transportation. However many people still claim that riding a bicycle is unsafe when they hear of a car getting into a collision with a cyclist.
The reality is that having less cars on the road will make the roads much safer.
The article, Your Risk of Getting Injured (or killed) in a Traffic Crash, more specifically the part with the stats, the numbers, titled: Kill Zone Traffic – Deaths, Injuries + Costs per Year, was unreadable, I don’t know what was going on but it was blurred, illegible, a different format to the rest of the article, so not a lot of good.
Then, on your website it said 22 people died in the UK due to traffic crashes in 2015, + around the world that figure was 15,343 in total for 2016. Where on earth do these figures come from? 22 fatalities for the whole of 2015 in the UK???
Then, the penny dropped, these are cyclists, just cyclists, a fact you make as clear as a pint of Guinness, then again, after looking another time for confirmation of what the figures represent, it doesn’t say anywhere, the figures represent only cyclists. So, as well as being vague as to what the figures claim to represent, the figures themselves are, to be frank, utter nonsense. I live in Vietnam where they’ve just released figures of around 8,500 fatalities due to RTA’s for 2016, which according to your 2016 worldwide total (15,343) accounts for more than 50% of the world’s RTA fatalities. If anyone could manage that it’s the Vietnamese, but despite their absence of road sense, + every other type of sense available, on occasion, something’s not right + my limited experience of this website already has my suspicion firmly aimed on you + this site. 1,700 is around the mark that you report as being 22 + were I to grade your site from a possible 1,700, 22 is about right, 20 I’m more comfortable with.
Finally, the software that handles this very message + your ‘contact us’ is the type that for me is worthy only of my contempt, the same level of respect I myself, + my ‘written’ work, my textual input, like these words I write now, in this moment, is shown when without permission or seeking any, without any warning or prompt, BOSH!!! Gone, wiped out of existence, everything I’d typed deleted, I didn’t even open another page but if I had the same thing would have happened, you lose your ‘work’.
This is commonplace in the world of PC’s + I don’t blame you for it, you probably weren’t even aware of it, but common, or not, it’s a disgrace + shows the status the user is so often awarded, what the Microsofts of this world have got people to accept as the norm is frightening, not everyone does, though. I thought I’d share my thoughts with you, my sole motivation is the idea of change for the better, your site could benefit from that ideal, I’d say, I have said, I’m saying it now…………….
Sincerely, in the main,
Si Hammer
I like most of the content of the article, but the statement that riding a bicycle (presumably where there is car traffic) is safer than a car based on the numbers 741 vs 32719 is invalid to say the least. How many miles did the cyclists in the US actually pedal, and how many BILLIONS of miles did the total of the motorists travel? Compare accidents per mile of travel, not number of accidents. This is why airplane travel (in the US) is so safe – it is injuries/deaths per mile traveled that is very very low.